.png?width=200&height=98&name=Horizontal%20PVFARM%20Logo%20(Small).png)
What Are Custom Reports?
Think of your layout as a box of fruits. Each object—trackers, boundaries, roads, combining boxes, or wires—is a type of “fruit” with unique parameters. A custom report is like sorting and labeling that box:
-
You can separate green apples from red apples (objects with the same type but different values).
-
When your layout changes in the 3D view (e.g., deleting or adding trackers), the custom report updates automatically in real time.


Understanding Properties and where to find them
One of the most important steps in understanding the Custom Report is understanding propertiesin PVFARM. Every object in PVFARM is a smart object, meaning it has many unique properties, you can access these by selecting an object then the Object Details panel. Those smart properties are what we'll be using to create our Custom Report.The Process for Creating a Report
- Filters- filtering allows you to work with only the objects you need.
-
The most common filter is Object Type.
-
You can also filter by visibility (hidden/shown) or by name (contains, begins with, equals).
-

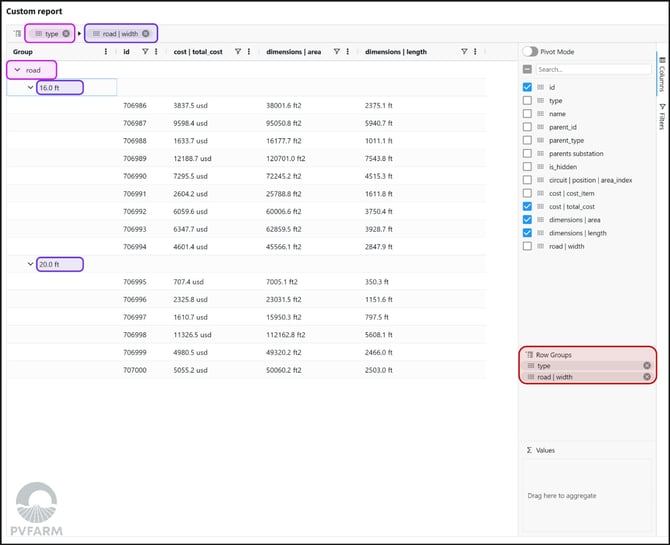
- Columns- Columns represent the parameters of your selected objects.
- Deselect unnecessary columns to focus on what matters.
- Example: For trackers, you might choose Type, Module Count, DC Power, Strings Count, and Module Power.
- Row groups- Grouping lets you build a breakdown structure by dragging parameters into group levels.
-
Example: Group trackers first by type, then by module count.
-
This collapses the list into organized categories that can be expanded for detail.
-
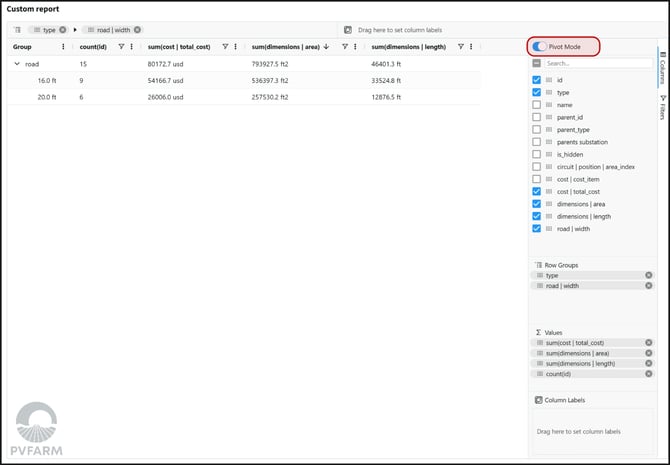
- Values- value aggregation enables you to calculate totals, averages, minimums, and maximums.
- Example: Summarize DC power, count objects, or calculate total strings per group.

- Pivot mode- Pivot mode rolls up values into a high-level summary.
-
Instead of seeing every tracker, you’ll see boxes labeled with total counts, power, or other aggregated metrics.
-
Think of it as wrapping your apples into boxes with labels rather than displaying each apple individually.
-
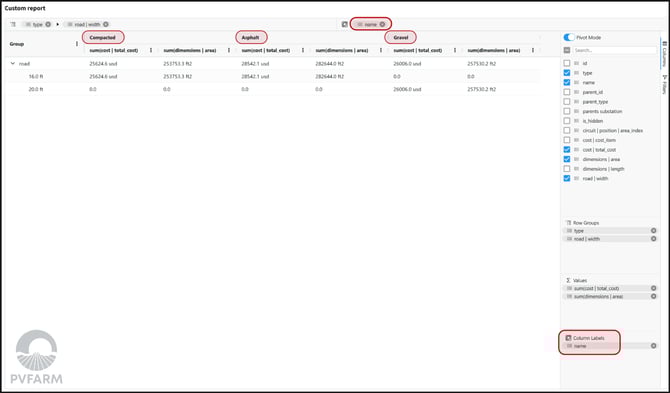
- Refine with Additional Parameters
-
Add columns such as Module Manufacturer to see differences within each group.
-
Apply filters for visibility or name if you only want to analyze specific objects.
-
- Export to Excel- once your report is set, expand all row groups and either right click and select export, or select the export button in the top right corner.

Tips and Tricks
- Start Simple!
- Begin with filtering by type and adding just a few columns.
- Use Templates
- Save your custom report as a template. Templates are shared with your team and reusable across projects.
- Filter Hidden Objects
- Use the visibility filter to include or exclude hidden objects.

- Use the visibility filter to include or exclude hidden objects.
- Name-Based Filters
- Filter objects by names that contain, equal, or begin with specific text.

- Filter objects by names that contain, equal, or begin with specific text.
- Chart creation- by right clicking in your report, you can navigate to the "chart range" option and create a chart of your choosing from the inputs that you've selected.